The Playwright Inspector stands as one of the most powerful debugging tools in the test automation ecosystem, transforming the way developers and testers approach test debugging. Unlike traditional debugging methods that rely heavily on console logs and guesswork, the Inspector provides a visual, interactive interface that allows you to step through your tests in real-time, inspect the DOM, and troubleshoot issues with unprecedented clarity.
What is Playwright Inspector?
Playwright Inspector is a GUI-based debugging tool that comes built-in with the Playwright framework. It serves as a comprehensive debugging environment that opens alongside your browser during test execution, providing real-time visibility into test execution, DOM states, and actionability logs. The Inspector eliminates the need for extensive logging or repeated test runs by offering immediate insights into what's happening during your test execution.
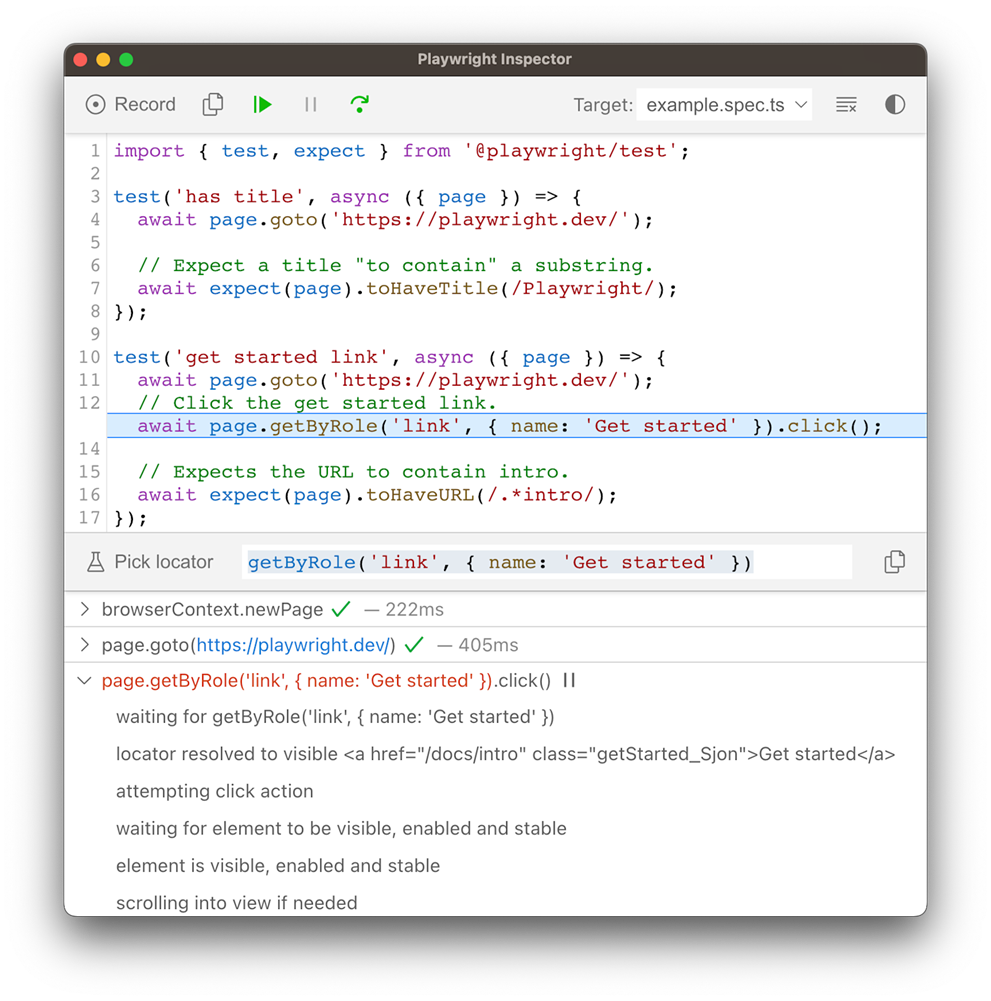
The Inspector interface showcases your test code on the left side while displaying detailed execution logs and actionability information on the right, making it easy to understand exactly what Playwright is doing at each step.
Key Features of Playwright Inspector
Step-by-Step Execution Control
The Inspector provides intuitive playback controls that allow you to play, pause, or step through each action of your test. The current action is highlighted in your test code, while matching elements are simultaneously highlighted in the browser window, creating a synchronized debugging experience that makes it easy to follow the test flow.
Live Locator Editing and Testing
One of the Inspector's most powerful features is the ability to edit locators in real-time. You can modify selectors directly in the Inspector interface and see the results immediately highlighted in the browser. This capability is invaluable when dealing with dynamic content or when you need to refine your element targeting strategies.
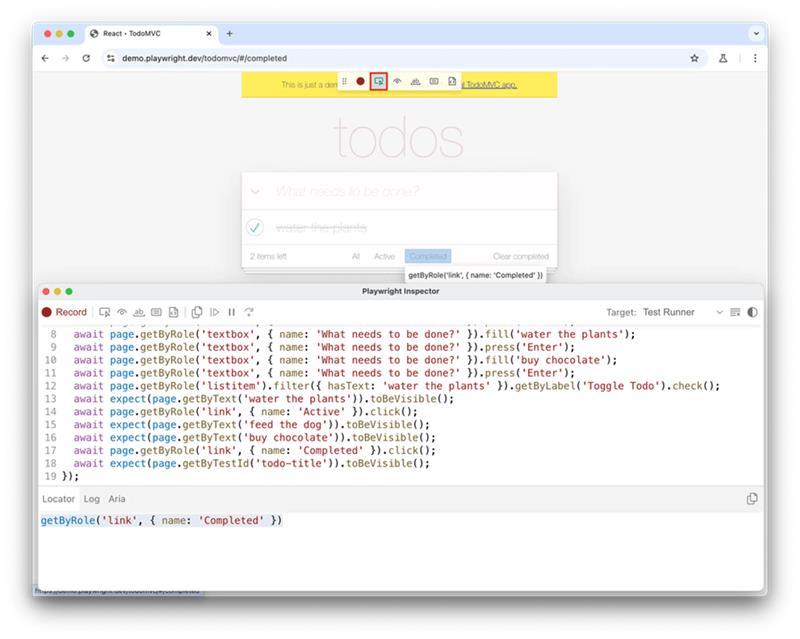
Screenshot of Playwright Inspector showing the pick locator feature used to create selectors for a React TodoMVC app test script.
This screenshot demonstrates the locator picking functionality in action, where the Inspector highlights the selected element and shows the corresponding locator code that Playwright would use to interact with that element.
Actionability Logs and Diagnostics
The Inspector provides detailed actionability logs that explain what Playwright attempted to do and why actions succeeded or failed. These logs include information about element visibility, stability, scrolling behavior, and timeout details, making it much easier to diagnose issues without guesswork.
Interactive Element Inspection
The "Pick Locator" feature allows you to hover over any element in the browser and instantly see the code needed to locate that element. Playwright intelligently prioritizes role-based, text-based, and test-id locators to provide the most resilient selector strategies.
Also Read: Mastering Parallelism in Playwright Test: Configuration, Scenarios, and Real-World Examples
How to Launch Playwright Inspector
Method 1: Debug Flag
The simplest way to launch the Inspector is by adding the --debug flag to your test command:
npx playwright test --debug
This approach launches all tests in debug mode, opening the Inspector for comprehensive debugging sessions.
Method 2: Environment Variable
For more targeted debugging, set the PWDEBUG environment variable:
# Windows PowerShell
$env:PWDEBUG=1
npx playwright test
# macOS/Linux
PWDEBUG=1 npx playwright test
# Windows Command Prompt
set PWDEBUG=1
npx playwright test
Method 3: Manual Pause Points
Insert await page.pause() at specific points in your test codeto trigger the Inspector at targeted locations:
test('Login flow debugging', async ({ page }) => {
  await page.goto('/login');
  await page.pause(); // Inspector opens here
  await page.fill('#email', 'test@example.com');
  await page.fill('#password', 'password123');
  await page.pause(); // Another inspection point
  await page.click('#loginButton');
});
This method provides precise control over when debugging begins, allowing you to focus on specific problematic areas.
Advanced Debugging Techniques
Conditional Breakpoints
You can implement conditional debugging by combining logical conditions with pause statements:
test('Conditional debugging example', async ({ page }) => {
  await page.goto('/dashboard');
  const userCount = await page.locator('.user-count').textContent();
  if (parseInt(userCount) < 10) {
    await page.pause(); // Only pause when condition is met
  }
  await page.click('#process-users');
});
Network Traffic Monitoring
The Inspector works seamlessly with Playwright's network interception capabilities, allowing you to monitor API calls and responses during debugging sessions:
test('Network debugging', async ({ page }) => {
  page.on('request', request =>
    console.log('>>', request.method(), request.url())
  );
  page.on('response', response =>
    console.log('<<', response.status(), response.url())
  );
  await page.pause(); // Inspect network activity
  await page.goto('/api-heavy-page');
});
Browser-Specific Debugging
The Inspector supports debugging across different browser engines. You can specify which browser to debug:
# Debug on Chromium
npx playwright test --project=chromium --debug
# Debug on WebKit
npx playwright test --project=webkit --debug
# Debug on Firefox
npx playwright test --project=firefox --debug
Also Read: Why Software Quality is a Business Risk, Not Just a Technical Concern
Best Practices for Inspector Debugging
Strategic Pause Placement
Place page.pause() statements strategically before complex interactions or after significant state changes. This approach allows you to verify the application state before proceeding with subsequent actions.
Locator Validation
Use the Inspector's live locator editing feature to test different selector strategies. Start with user-facing attributes like roles and text content, then fall back to CSS selectors if necessary.
Combine with Trace Viewer
For comprehensive debugging workflows, enable tracing alongside Inspector debugging:
// In playwright.config.js
module.exports = {
  use: {
    trace: 'on-first-retry',
  },
};
This combination provides both interactive debugging and post-execution analysis capabilities.
Environment-Specific Configuration
Configure different debugging setups for various environments:
// playwright.config.js
module.exports = {
  projects: [
    {
      name: 'debug',
      use: {
        headless: false,
        slowMo: 100, // Slow down for better observation
      },
    },
  ],
};
Troubleshooting Common Issues
Flaky Test Debugging
When dealing with intermittent test failures, use the Inspector to examine timing issues:
test('Flaky element interaction', async ({ page }) => {
  await page.goto('/dynamic-content');

  // Wait and inspect before interacting
  await page.pause();
  await page.waitForSelector('.dynamic-element', { state: 'visible' });

  // Verify element state
  await page.locator('.dynamic-element').highlight();
  await page.click('.dynamic-element');
});
Element Visibility Issues
Use the Inspector to diagnose visibility problems by examining the DOM state and CSS properties at the moment of failure.
Timeout Debugging
The Inspector's actionability logs provide detailed information about why actions timeout, including waiting states, element checks, and retry attempts.
Also Read: Are We Truly Covered? Unseen Risks in Software Testing
Integration with VS Code
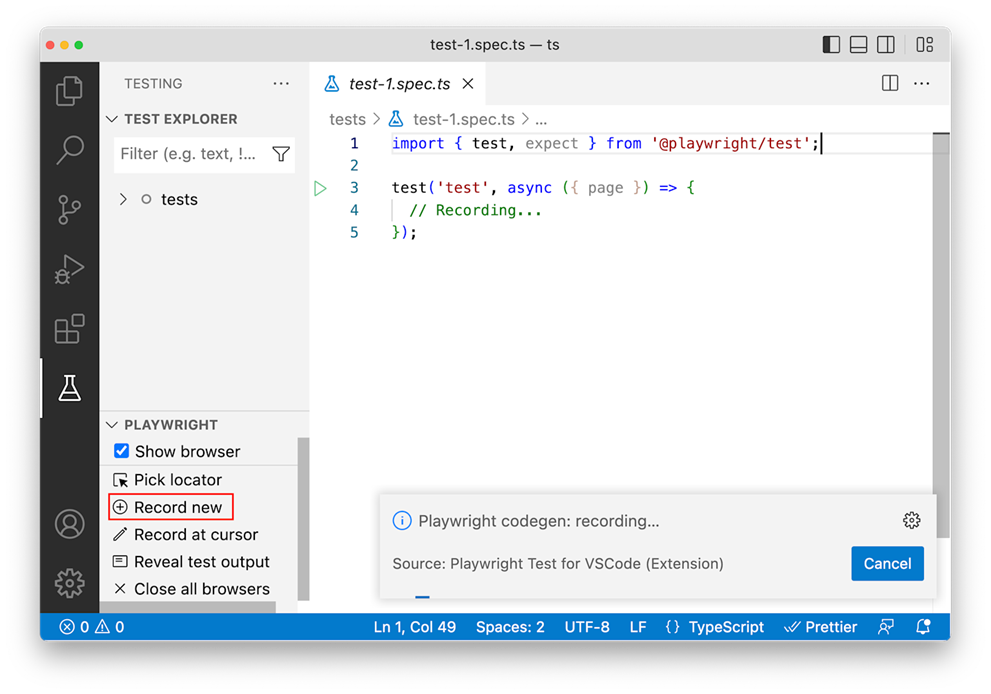
Playwright test recorder interface in VS Code showing recording in progress and locator picking options.
The Playwright VS Code extension enhances the debugging experience by integrating Inspector functionality directly into your development environment. You can set breakpoints, step through code, and use the "Pick Locator" feature without leaving your editor.
The extension provides features like:
- Live debugging with browser synchronization
- Error highlighting with detailed failure information
- Integrated locator picking for streamlined test development
- Multi-browser debugging support
Performance Considerations
When using the Inspector for debugging:
- Disable timeouts are automatically set to zero in debug mode to prevent interruptions
- Headed mode is enabled by default for visual debugging
- Slow motion can be configured to observe rapid interactions
- Network throttling can be applied to simulate real-world conditions
The Inspector transforms Playwright debugging from a time-consuming guessing game into an efficient, visual process. By providing real-time insights into test execution, DOM states, and element interactions, it enables developers to quickly identify and resolve issues that would otherwise require extensive investigation.
Whether you're troubleshooting flaky tests, refining locator strategies, or understanding complex user interactions, the Playwright Inspector serves as an indispensable tool that bridges the gap between test code and browser behavior, ultimately leading to more reliable and maintainable test suites.