Trace Viewer is not just a visual debugging tool - it’s an execution time machine. It captures granular snapshots of user actions and renders an interactive timeline that enables both manual and automated test engineers to precisely identify where and why a failure occurred.
Debugging failed tests can be one of the most time-consuming aspects of test automation. Traditional debugging methods often leave you guessing what went wrong, forcing you to rerun tests multiple times with different configurations. Playwright's Trace Viewer revolutionizes this process by providing a complete forensic view of your test execution. Instead of piecing together clues from screenshots and logs, you get a comprehensive recording of everything that happened during your test run.
What is Playwright Trace Viewer?
Playwright Trace Viewer is a GUI tool that captures and displays detailed execution traces of your tests, making Playwright Trace Viewer debugging much easier. Think of it as a flight recorder for your automated tests—it records every action, DOM change, network request, and console message that occurs during test execution. When a test fails, instead of just seeing an error message, you can replay the entire test execution step-by-step, inspect the page at any moment, view network requests, and examine console logs all synchronized together.
The Trace Viewer provides a time-travel debugging experience where you can pause at any moment during test execution and inspect the complete browser state. This includes not just screenshots, but actual DOM snapshots that you can interact with using developer tools.
Key Features and Components
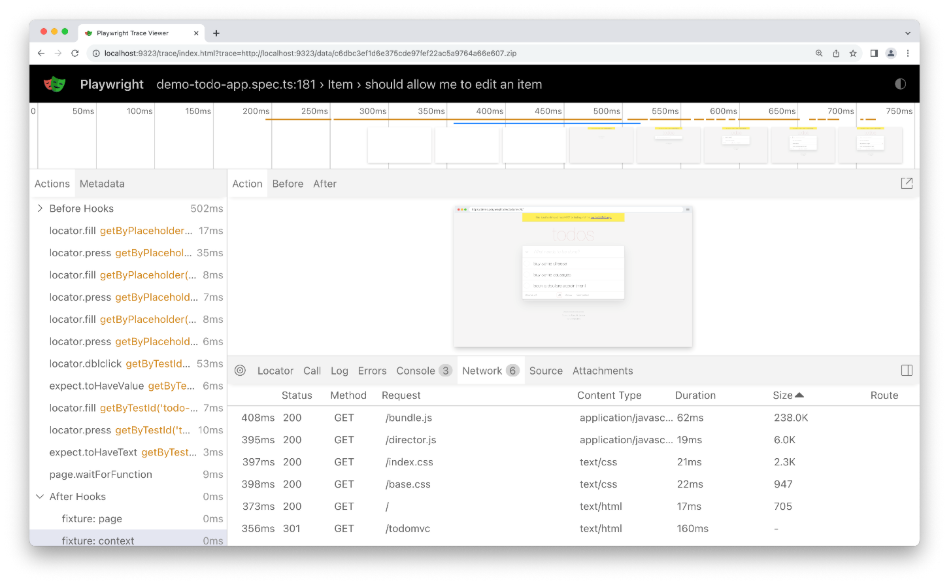
Timeline and Action Visualization
The Timeline provides an overview of the entire test execution with visual bars representing each action. Long bars indicate slow actions, while red markers show where failures occurred. This timeline view makes it easy to identify performance bottlenecks and pinpoint exactly when things went wrong.
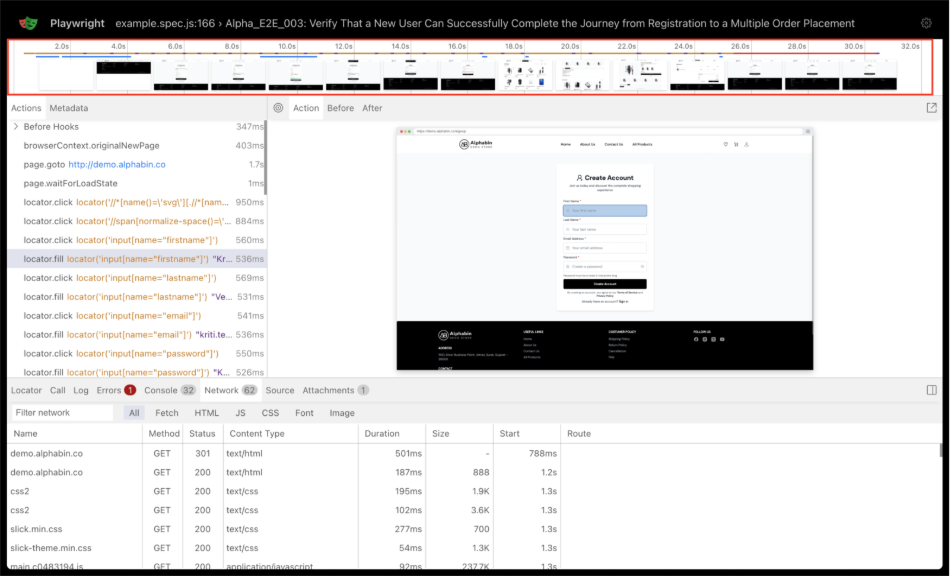
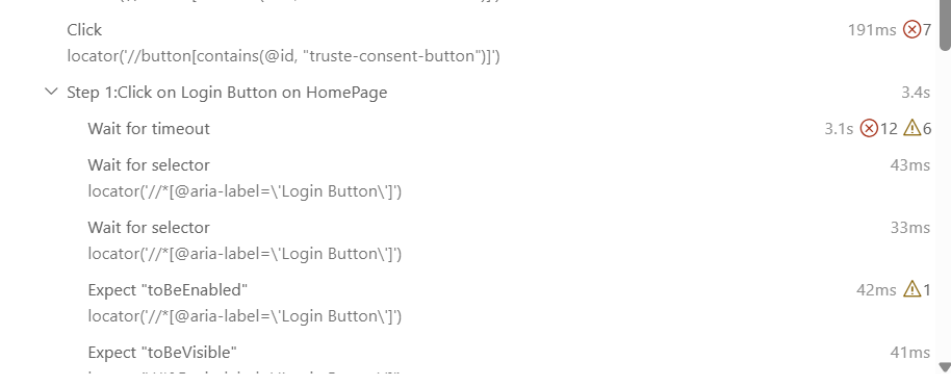
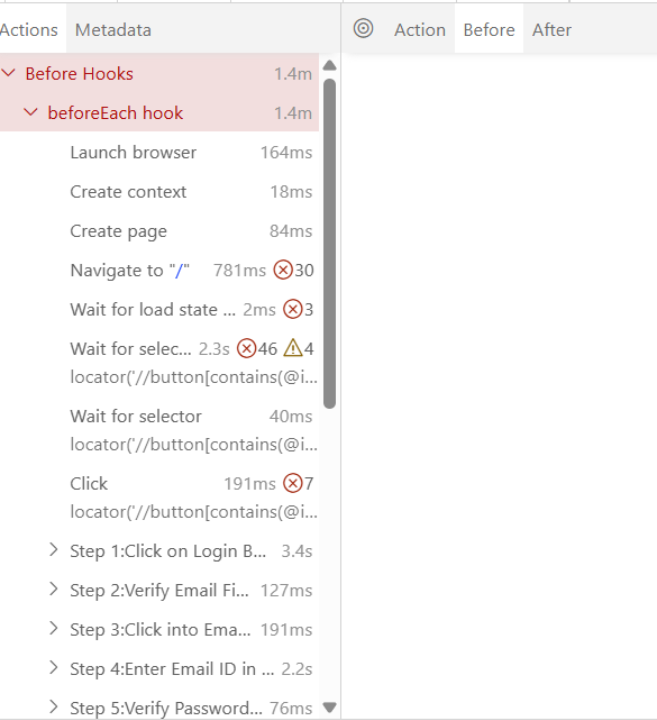
Action-by-Action Breakdown
The Actions Panel lists every action performed during your test, including clicks, navigations, and assertions. Each action shows:
- The locator used for the action
- Execution duration
- Action snapshots showing before and after states
- Source code location
- Associated network logs
Also Read: Mastering Playwright: The Modern Developer’s Guide to Reliable End-to-End Testing
DOM Snapshots
One of the most powerful features is the DOM snapshot capability. For each action, Playwright captures complete DOM snapshots that you can inspect like a paused browser. You can:
- Toggle between "Before" and "After" states for each action
- Inspect elements using developer tools
- Check computed styles and data attributes
- Examine the exact click position for interactions
Network Activity Monitoring
The Network Tab captures all HTTP requests and responses with full details including:
- Request and response headers
- Response codes and timing information
- Request payloads and response bodies
- Network waterfall visualization
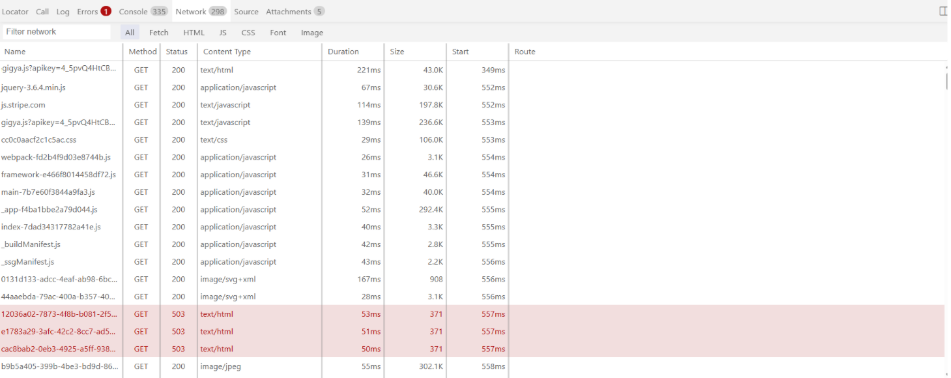
This is particularly valuable for debugging API-related issues that might not be visible in the UI but affect test behavior.
Console Logs Integration
All console messages, warnings, and JavaScript errors are captured and synchronized with the timeline. This helps identify issues like "undefined is not a function" errors that might not fail your test but explain unexpected behavior.
Setting Up Trace Recording
Configuration Options
Trace recording is configured in your playwright.config.ts file with several options:
import { PlaywrightTestConfig } from '@playwright/test';
const config: PlaywrightTestConfig = {
  use: {
	trace: 'on-first-retry', // Recommended for CI
  },
  retries: 1, // Enable retries for trace capture
};
export default config;
Available trace options:
- 'off' - Do not record traces
- 'on' - Record trace for each test (performance heavy)
- 'retain-on-failure' - Record traces for all tests but remove successful ones
- 'on-first-retry' - Record traces only when retrying a test (recommended for CI)
Programmatic Trace Control
For more granular control, you can start and stop tracing programmatically:
test('debug specific flow', async ({ page, context }) => {
  // Start tracing before critical actions
  await context.tracing.start({
	screenshots: true,
	snapshots: true,
	sources: true
  });
  await page.goto('https://example.com');
  // ... test actions ...
  // Stop tracing and save to file
  await context.tracing.stop({ path: 'trace.zip' });
});
Also Read: Dynamic Class Loading for Page Objects in Playwright Automation
Chunked Tracing for Complex Tests
For long tests or authentication flows, use trace chunks to create focused traces:
await context.tracing.start({ screenshots: true, snapshots: true });
This approach creates separate trace files for different parts of your test, making debugging more efficient.
// Login flow
await context.tracing.stopChunk({ path: 'login-trace.zip' });
await context.tracing.startChunk();
// Main test flow
await context.tracing.stopChunk({ path: 'test-trace.zip' });
Viewing and Analyzing Traces
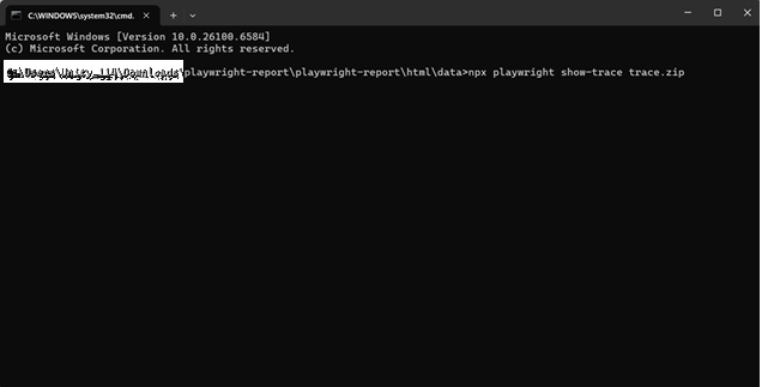
Local CLI Method
Open trace files using Playwright's command line interface:
npx playwright show-trace path/to/trace.zip This launches the trace viewer in your default browser with full offline capabilities.
Using trace.playwright.dev - The Web-Based Trace Viewer
trace.playwright.dev is a statically hosted variant of the Trace Viewer that runs entirely in your web browser. This web-based approach eliminates the need for local CLI installations and makes trace sharing incredibly simple. You can access it by simply navigating to https://trace.playwright.dev in any modern web browser.
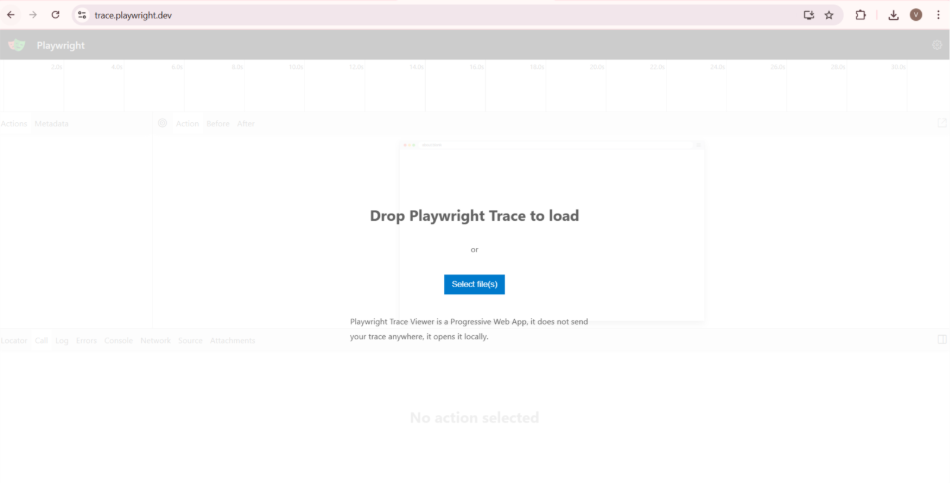
Browser-Based Debugging Without Installation
The web viewer provides two convenient methods for uploading trace files:
- Drag and drop: Simply drag your trace.zip file directly onto the web page
- File selection: Click the "Select file(s)" button to browse and upload trace files from your system
Privacy and Security Advantages
One of the most compelling aspects of trace.playwright.dev is its privacy-first architecture. The Trace Viewer loads the trace entirely in your browser and does not transmit any data externally. This means:
- Your trace data never leaves your local machine
- No server-side processing or storage occurs
- Sensitive information in your traces remains completely private
- You can safely analyze traces containing authentication data or proprietary information
This client-side processing approach makes it ideal for teams working with sensitive applications where uploading debug data to external services would violate security policies.
Also Read: Mastering Playwright Inspector: The Ultimate Guide to Visual Debugging
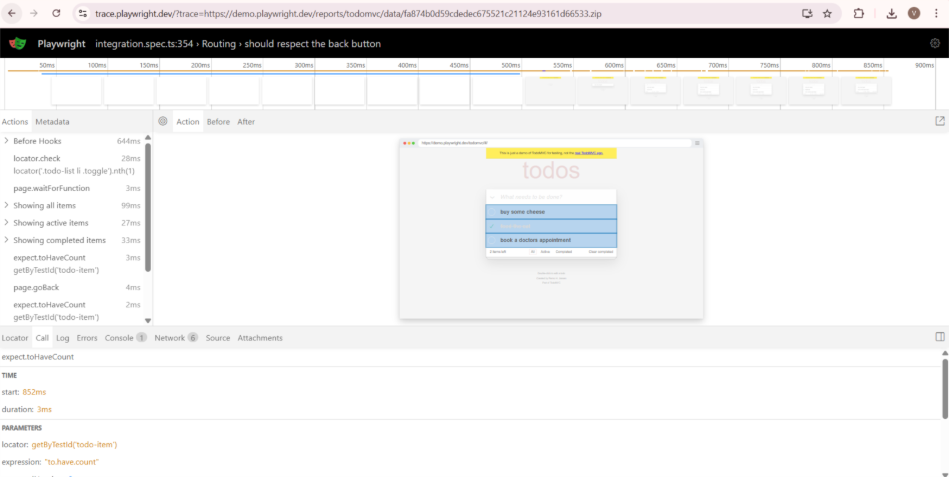
Remote Trace Integration
The web viewer supports direct URL-based trace loading, making CI integration seamless. You can pass trace URLs as query parameters:
https://trace.playwright.dev/?trace=https://demo.playwright.dev/reports/todomvc/data/fa874b0d59cdedec675521c21124e93161d66533.zip This feature enables direct links from CI reports to trace analysis. When your GitHub Actions or Jenkins pipeline generates traces, team members can click directly from the build report to view traces without downloading files locally.
Comparison: Web Viewer vs Local CLI
CI Integration and Artifact Collection
For continuous integration environments, traces are automatically collected when tests fail. Configure your CI pipeline to upload trace artifacts:
# GitHub Actions example
- name: Upload test results
  uses: actions/upload-artifact@v3
  if: always()
  with:
	name: playwright-traces
	path: test-results/
The HTML test report includes direct links to trace files, making it easy to access traces from failed CI runs.
Advanced Debugging Techniques
Flaky Test Analysis
For intermittent test failures, run the same test multiple times and compare traces:
- Run until the test fails, save the trace
- Run until it passes, save the trace
- Compare both traces side-by-side
Look for differences in timing, network responses, or DOM states that might explain the flaky behavior
Multi-Browser Debugging
When tests behave differently across browsers, collect traces from all browser types:
// Run same test across browsers
test.describe('Cross-browser test', () => {
  ['chromium', 'firefox', 'webkit'].forEach(browserName => {
	test(`Test in ${browserName}`, async ({ browser }) => {
  	// Test implementation with tracing enabled
	});
  });
});
Compare traces to identify browser-specific issues like CSS rendering differences or JavaScript compatibility problems.
Performance Bottleneck Identification
Use the timeline view to identify slow operations:
- Long bars in the timeline indicate slow actions
- Network tab shows request timing
- DOM snapshots reveal rendering delays
- Console logs may show performance warnings
This helps optimize both your application and test execution speed.
Best Practices and Performance Considerations
Optimizing Trace Collection
Trace files can become large (47MB or more for complex applications). To manage size and performance:
- Use 'on-first-retry' instead of 'on' for CI environments
- Disable screenshots if DOM snapshots are sufficient
- Use chunked tracing for long test sequences
- Clean up trace files regularly in CI environments
When to Use Traces
Recommended scenarios:
- When debugging hard-to-reproduce bugs
- To analyze state-dependent bugs (like dropdowns or modals)
- To compare test behavior before and after a deployment
Avoid for:
- Every test run in development (performance impact)
- Simple unit tests that don't involve browser interaction
- Tests that already have sufficient logging
Production Debugging Considerations
While traces provide extensive debugging capabilities, they can impact test performance. For production environments:
- Enable tracing selectively for critical test paths
- Monitor trace file sizes and storage usage
- Implement trace retention policies
- Consider using 'retain-on-failure' to automatically clean up successful test traces[6]
Team Collaboration Workflows
Automated Trace Analysis
The trace data can be integrated with broader testing workflows:
- Automatic trace collection on CI failures
- Integration with test reporting tools
- Slack/email notifications with trace file attachments
- Custom analysis scripts for pattern detection
Enhanced Team Debugging
Traces enhance team debugging workflows:
For Remote Teams: Share trace.zip files via Slack, email, or cloud storage. Team members can immediately analyze traces without installing Playwright locally using trace.playwright.dev.
For Client Demos: When demonstrating test failures to stakeholders, the web viewer provides a professional, accessible interface that doesn't require technical setup.
- Sharing trace playback links in client calls can replace manual screen recordings. You get full control over what was executed, and clients appreciate seeing real evidence behind reported issues.
For Cross-Team Debugging: QA engineers can share traces with developers who may not have Playwright installed, enabling faster issue resolution.
In one team, QA shared a trace.zip with DevOps to debug an authentication issue. Without needing Playwright installed, DevOps opened the trace on trace.playwright.dev and fixed a misconfigured cookie flag.
Self-Hosted Alternatives
Organizations requiring complete control over trace analysis can set up self-hosted versions. The trace viewer is available as a React application in the Playwright repository that can be built and deployed internally:
# Build from Playwright source
git clone https://github.com/microsoft/playwright.git
cd playwright/packages/trace-viewer
npm install && npm run build
This approach provides the same functionality as trace.playwright.dev while maintaining complete data sovereignty.
Conclusion
Playwright's Trace Viewer transforms debugging from a time-consuming guessing game into a systematic analysis process. By providing complete visibility into test execution through both local CLI tools and the convenient web-based trace.playwright.dev interface, it enables faster issue resolution and more reliable test automation.
The combination of detailed execution recording, privacy-first web viewing, and seamless CI integration makes trace debugging accessible to entire development teams. The key is using traces strategically - enabling them for CI failures and complex debugging scenarios while being mindful of performance impacts in everyday development workflows.
Whether you're dealing with flaky tests, cross-browser compatibility issues, or complex user flows, the Trace Viewer provides the forensic detail needed to understand exactly what happened during test execution and resolve issues quickly and confidently.
Trace Viewer compresses what used to be hours of guesswork into minutes of precision debugging. Whether you’re chasing flaky tests or optimizing CI pipelines, it gives you the clarity and confidence to resolve issues fast.