In today’s digital-first world, performance isn’t optional it’s expected. Whether you're developing a web application, mobile backend, or REST API, ensuring it can withstand real-world usage is critical to your success.
This is where performance testing steps in, and Apache JMeter becomes your best ally.
In this blog, we’ll walk you through a step-by-step guide on how to perform effective performance testing using JMeter. You’ll learn how to simulate user load, identify bottlenecks, and generate reports all using a powerful open-source tool trusted by QA Engineers, Performance Testers, and Developers worldwide.
Whether you’re a beginner QA Intern or an experienced Automation Engineer looking to level up your performance testing skills, this guide will equip you with practical knowledge and hands-on examples.
What Is Performance Testing and Why It Matters
Performance testing evaluates how a system behaves under load including speed, responsiveness, and stability. Its goal is to identify performance bottlenecks before they impact users.
Here’s why performance testing is essential:
- Ensures smooth user experience during peak loads
- Helps validate scalability of web apps, APIs, and systems
- Reduces downtime and revenue loss caused by crashes
- Boosts customer confidence and brand reputation
Why JMeter?
Apache JMeter is one of the most popular tools for performance testing due to:
- Open-source flexibility and active community
- Support for HTTP(S), SOAP/REST APIs, JDBC, FTP, JMS, etc.
- Easy test creation through GUI or scripting
- Advanced reporting and result analysis features
Step-by-Step Guide to Performance Testing with JMeter
1. Download and Install JMeter
- Visit the official Apache JMeter website
- Download the latest binary release (ZIP or TGZ)
- Extract and navigate to /bin directory
- Launch jmeter.bat (Windows) or jmeter.sh (Linux/Mac)
Tip: Make sure Java (JDK 8 or above) is installed and JAVA_HOME is set correctly.
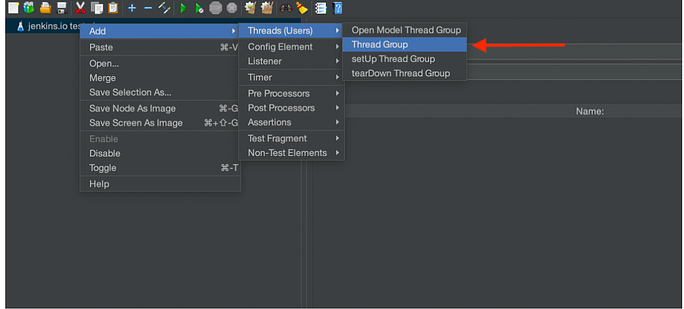
2. Create a Test Plan
The Test Plan is the root container of your performance test. Think of it as the script that holds all components.
In JMeter GUI:
- Right-click on Test Plan → Add → Threads (Users) → Thread Group
- Define number of users (threads), ramp-up period, and loop count
Example:
- Threads: 50
- Ramp-up: 10 seconds
- Loop Count: 1
This will simulate 50 users spread over 10 seconds.
3. Add a Sampler (e.g., HTTP Request)
Samplers are the actions your virtual users will perform — such as a login request or API call.
To add an HTTP Request:
- Right-click on Thread Group → Add → Sampler → HTTP Request
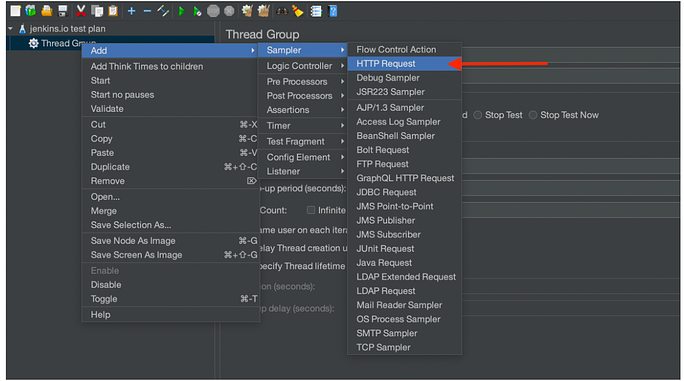
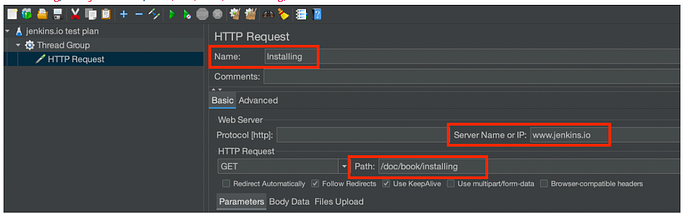
- Enter details like:
- Server Name or IP: example.com
- Method: GET or POST
- Path: /login or /search
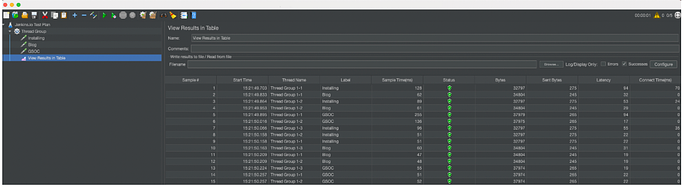
4. Add Listeners for Reporting
Listeners display the results of your test execution.
Common listeners to add:
- View Results Tree
- Summary Report
- Aggregate Report
- Graph Results
To add:
Right-click on Thread Group → Add → Listener → [Select your listener]
Tip: Avoid adding too many listeners for large tests as they consume memory.
5. Add Configuration Elements (Optional)
- HTTP Request Defaults: Set common parameters (base URL, port)
- CSV Data Set Config: For passing dynamic test data like usernames
- HTTP Cookie Manager: To maintain session state
Example: Simulate login with different user credentials using CSV.
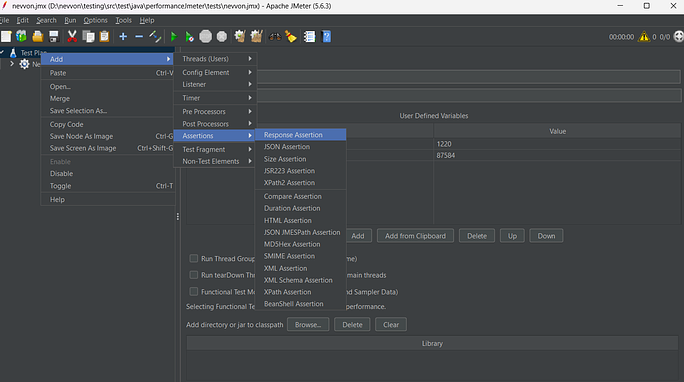
6. Add Assertions (Optional but Useful)
Assertions help validate server response (status code, text, time).
To add:
- Right-click on HTTP Request → Add → Assertions → Response Assertion
- Set conditions like: Response contains “Welcome” or Response Code = 200
7. Run the Test
Click the green start button.
While the test is running, observe:
- CPU/RAM usage on system under test
- Server logs for errors
- Live stats from Listeners
8. Analyze the Results
After test execution:
- Check Average, Min, Max response times
- Monitor throughput (requests/sec)
- Identify failed requests or high latency
- Use Aggregate Report and Summary Report for insights
Sample metrics:
- 95th percentile response time
- Error rate %
- Hits per second
Export reports or use JMeter’s HTML Report Dashboard for professional reporting.
Common Use Case Scenarios in JMeter
Login Test Simulation
- Threads: 20
- Sampler: POST to /api/login
- Data: CSV file with user credentials
- Validation: Response Code = 200
Search Load
- Threads: 100
- Sampler: GET to /search?q=laptop
- Assertion: Response contains “results”
Best Practices for JMeter Performance Testing
- Use realistic test data (via CSV or APIs)
- Warm up your test environment before collecting results
- Avoid GUI mode for large-scale tests — use command-line (non-GUI mode)
- Monitor backend resources (CPU, memory, DB connections)
- Run tests in staging or dedicated environments to avoid production risk
- Use timers (e.g., Constant Timer) to simulate real user behavior
Generating Reports via Command Line
To run JMeter tests in headless mode and generate HTML reports:
Command:
jmeter -n -t test-plan.jmx -l results.jtl -e -o HTMLReport
Where:
- -n = non-GUI mode
- -t = test plan file
- -l = result log file
- -e = enable report generation
- -o = output folder for HTML report
Conclusion
Apache JMeter empowers testers to conduct thorough performance testing at scale whether it’s for REST APIs, web portals, or complex transactional flows. With a structured approach and well-defined scenarios, you can pinpoint bottlenecks before they impact end users.
Start small perhaps with a login test then build toward more complex workflows like search and checkout.
The key is consistency and continuous analysis.