Performance testing helps teams evaluate how applications behave under different load conditions. It focuses on response times, system stability, and resource usage across environments.
As modern applications grow more distributed, performance risks appear earlier in the lifecycle.
Testing tools help teams identify bottlenecks before they affect end users.
LoadRunner and JMeter are widely referenced performance testing tools.
They are used across industries to support different testing objectives and delivery models.
Related Read: What is Performance Testing?
Key Takeaways
- Performance testing tools are most effective when selected based on application architecture and delivery context, not feature lists alone.
- LoadRunner is commonly used in environments that require protocol-level accuracy and structured performance testing cycles.
- JMeter is frequently applied in scenarios that emphasize web and API testing, along with iterative and automated execution.
- Differences between tools often surface in test creation workflows, execution models, and reporting approaches, rather than core testing intent.
- Teams usually evaluate these tools when planning for scalability needs, integration with existing pipelines, and long-term maintenance.
- Real-world usage scenarios play a critical role in understanding how a tool fits into day-to-day testing practices.
- Clear performance objectives and realistic test scenarios help teams gain meaningful insights, regardless of the tool used.
LoadRunner at a glance
What is LoadRunner?
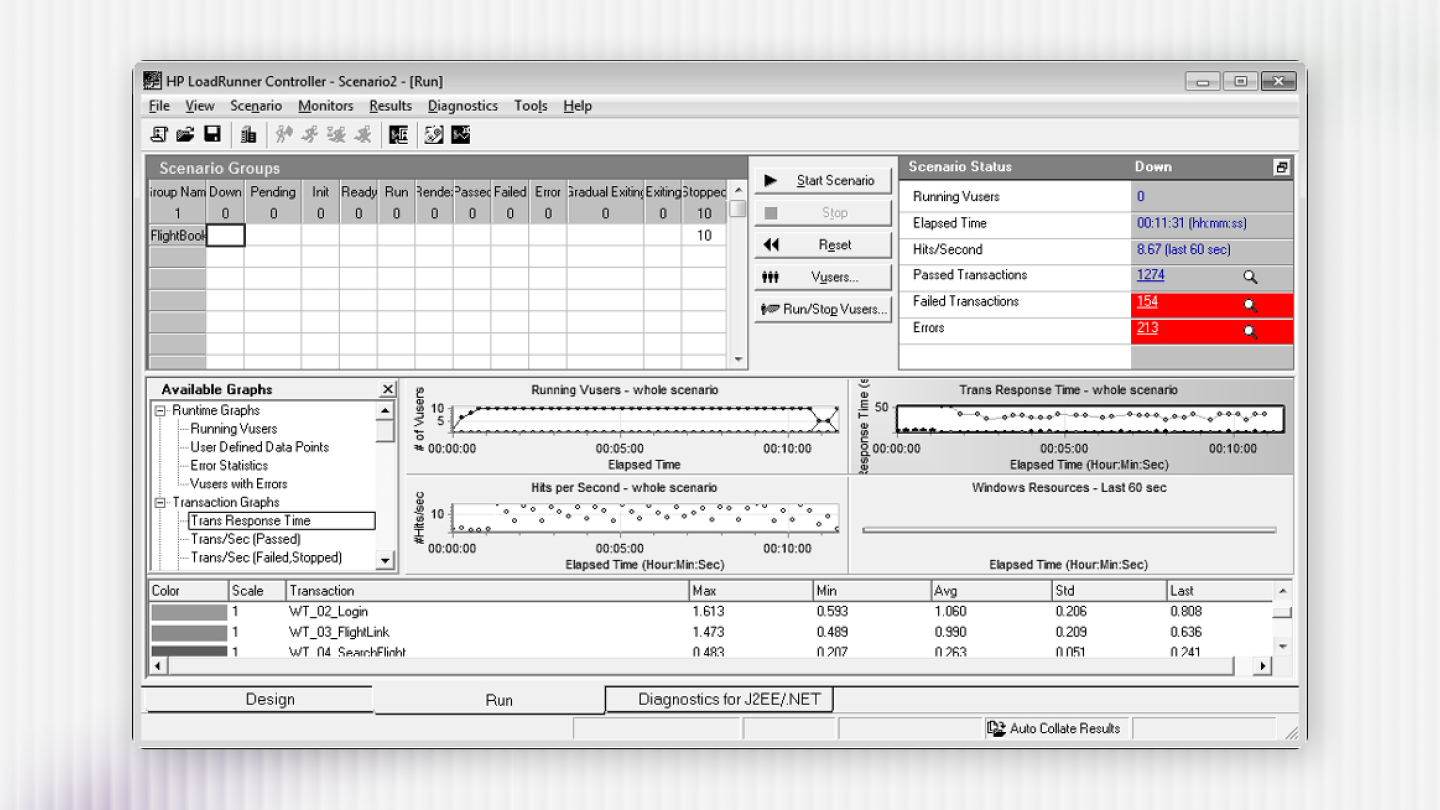
LoadRunner is a performance testing tool designed to simulate virtual users interacting with systems. It is commonly used in enterprise environments where controlled load modeling is required.
The tool focuses on protocol-level communication rather than UI-based interactions.
This allows teams to test complex backend and multi-tier architectures.
LoadRunner is typically used to validate system behavior before major releases.
It supports structured performance testing phases.
Test Creation and Execution
Test creation in LoadRunner usually begins with selecting the appropriate protocol.
User interactions are recorded or scripted to represent real workflows.
Scripts are refined to ensure accuracy and reliability, including:
- Parameterization of dynamic data
- Correlation of session-specific values
- Transaction tagging for response measurement
Execution involves configuring virtual users, ramp-up patterns, and run duration.
Tests are observed in real time to monitor system response.
Environment and Protocol Coverage
LoadRunner supports a wide range of protocols and enterprise technologies.
This makes it suitable for testing complex application landscapes.
Commonly covered areas include:
- Web and application servers
- Database interactions
- ERP and CRM systems
- Legacy and proprietary protocols
This breadth helps teams test integrated systems as a whole.
It is often used where protocol accuracy is critical.
Scalability and Delivery Model Usage
LoadRunner supports large-scale load generation through distributed execution.
Multiple load generators can be configured to simulate high user volumes.
It is commonly applied in delivery models that include:
- Pre-release performance validation
- System-wide regression testing
- Capacity and stress testing
These scenarios often require predictable and repeatable test execution.
LoadRunner aligns with such structured testing needs.
Support and Ecosystem Context
LoadRunner is supported through vendor documentation and professional services.
This structure helps teams plan long-term testing strategies.
Support typically includes:
- Official documentation and updates
- Tool maintenance and version upgrades
- Enterprise-grade technical assistance
Organizations often align LoadRunner usage with broader QA governance models.
This supports consistency across large teams.
JMeter at a glance
What is JMeter?
JMeter is a performance testing tool used to generate load and observe system behavior.
It is widely applied to web applications, APIs, and service-based architectures.
The tool uses a test plan model built from reusable components.
This allows teams to define requests, logic, and result collection clearly.
JMeter is often used in environments where flexibility and quick iteration are important.
It supports both exploratory and automated performance testing.
Test Creation and Execution
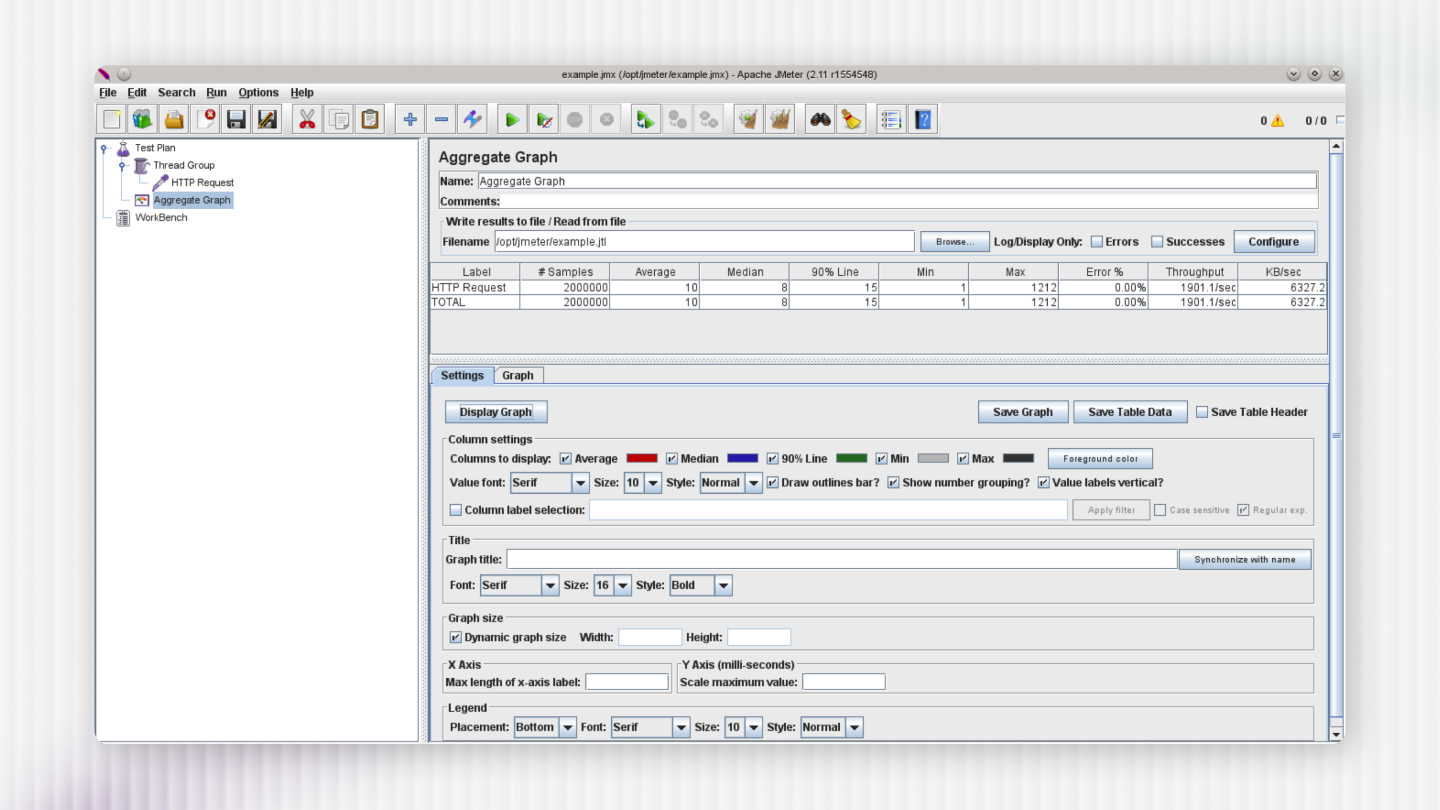
JMeter test creation involves assembling test plans using configurable elements.
These elements define how requests are sent and how responses are measured.
Key components commonly used include:
- Samplers for sending requests
- Controllers for defining logic and flow
- Timers for pacing requests
- Listeners for collecting results
Tests can be executed through the UI or via command line.
This enables both local testing and automated runs.
Environment and Protocol Coverage
JMeter primarily focuses on web-based protocols and services.
It is commonly used for testing modern application stacks.
Typical usage includes:
- HTTP and HTTPS applications
- REST and SOAP APIs
- Messaging systems and queues
Its plugin ecosystem allows teams to extend functionality.
This flexibility supports evolving testing requirements.
Scalability and Delivery Model Usage
JMeter is frequently used in agile and DevOps-driven delivery models.
Its lightweight setup supports frequent test execution.
Distributed testing can be configured using coordinated instances.
This allows load generation across multiple machines.
JMeter fits well in scenarios such as:
- Continuous integration pipelines
- Iterative performance checks
- API-level performance validation
These use cases emphasize speed and adaptability.
Support and Ecosystem Context
JMeter is supported by an active open-source community.
Users rely on shared resources and community contributions.
Support typically comes from:
- Community documentation and guides
- Online forums and discussions
- Open-source plugins and extensions
This ecosystem encourages experimentation and customization.
Teams often tailor JMeter usage to their workflows.
How Do LoadRunner and JMeter Differ in Practice?
LoadRunner usage is centered around protocol-driven scripting and controlled execution.
This approach supports detailed modeling of enterprise transactions.
JMeter usage emphasizes flexible test plans and component-based construction.
This supports rapid test creation and frequent updates.
LoadRunner analysis relies on built-in reporting and visualization tools.
These reports focus on transaction behavior and system metrics.
JMeter results are collected through listeners and external reporting tools.
Teams often integrate results with dashboards and monitoring systems.
Also Read: LoadRunner vs JMeter
How to choose from both?
Tool selection is usually driven by project needs rather than tool characteristics alone.
Different contexts influence how teams approach performance testing.
LoadRunner fits well when:
- Systems involve complex enterprise protocols
- Testing requires structured execution cycles
- Dedicated performance testing phases are planned
JMeter aligns well when:
- Applications are API- or web-focused
- Teams follow agile or DevOps practices
- Frequent and automated testing is required
Team skills, timelines, and maintenance expectations also influence decisions.
Also Read: Loadrunner Vs Jmeter Tool Capabilities and Comparative Analysis
Final Thoughts
Performance testing tools are most effective when they align with the application architecture, delivery model, and testing goals. Understanding how tools are typically used helps teams apply them with clarity and intent.
LoadRunner and JMeter are both adopted across varied testing contexts. Their usage is shaped by factors such as system complexity, release cadence, and team structure.
In practice, teams often benefit from guidance that goes beyond tool features. This includes defining realistic test scenarios, interpreting results correctly, and aligning performance testing with business risk.
At QAble, performance testing is approached as a context-driven activity rather than a tool-led exercise. The focus remains on understanding system behavior, selecting suitable testing approaches, and supporting teams across different delivery models.
By grounding tool usage in clear objectives and practical scenarios, teams can derive meaningful insights. This helps ensure performance testing contributes effectively to overall software quality.